Quiz Statistics
Overview
Accessing Quiz Statistics
Quiz statistics are available after one submission has been made to a quiz with less than 100 questions or with less than 1000 submissions. To access quiz statistics:
- Go to the quiz.
- Under "Related Items" on the right-hand sidebar, select "Quiz Statistics".
Understanding Quiz Statistics
Quiz statistics use Cronbach's alpha measures to help instructors tell how well-written their quiz was. If a quiz is well written, or reliable, there should be trends present. For example, a question could be proved reliably difficult if most high-scoring students answer it correctly, while most low-scoring students answer it incorrectly.
Here is a pdf that explains how quiz statistics are generated and how to understand them.
Quiz Summary
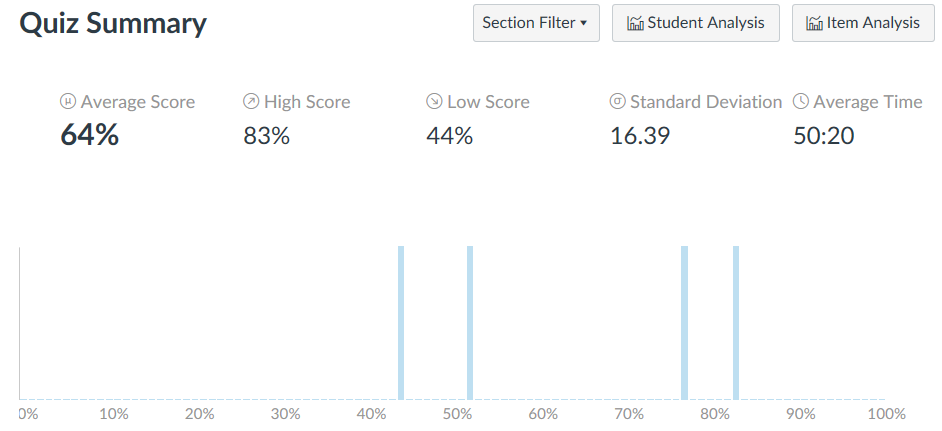
The Quiz summary gives an overview of the quiz results, including the average score, high score, low score, standard deviation, and average time. There is also a bar graph showing the distribution of student scores. You also have the options next to the quiz summary to filter the quiz statistics by section, or download a student analysis or item analysis. The student analysis will show a breakdown of each student's attempt at the quiz, with their answers for each question and how many points they received. The item analysis goes into much more detail, showing for each question: answered student count, top student count, middle student count, bottom student count, quiz question count, correct student count, wrong student count, correct student ratio, wrong student ratio, correct top student count, correct middle student count, correct bottom student count, variance, standard deviation, difficulty index, alpha, point biserial of correct, point biserial of distractor 2, point biserial of distractor 3, and point biserial of distractor 4.
Question Breakdown
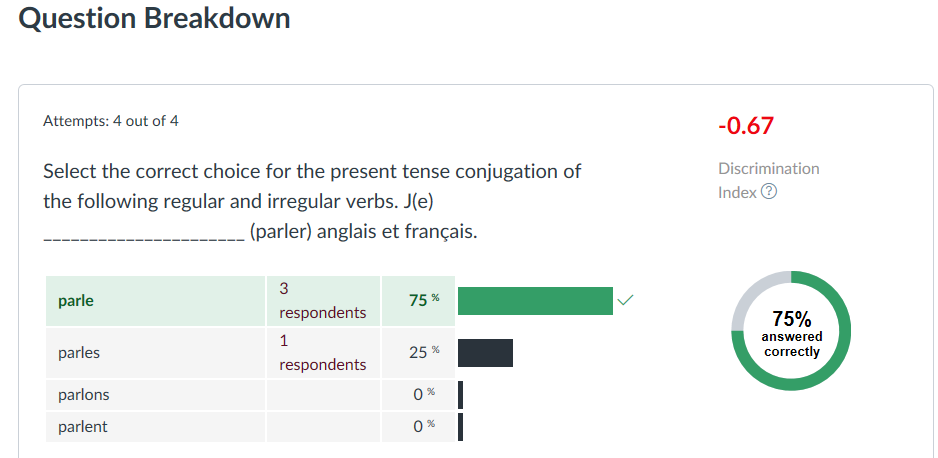
The question breakdown shows a visual representation of the different answers students gave to a particular question. For each question, the question breakdown shows the percentage of students that chose each answer, a pie chart of how many students answered correctly, and a discrimination index value.
Discrimination Index
The discrimination index is a measure of how well a question can tell the difference between students who do well on an exam and those who do not. A good discrimination index score is +0.25 or higher, while a poor discrimination index score in less than +0.24.
Additional Resources