Canvas Course New Analytics
How to activate New Analytics link in Course Navigation
- Go to Settings, in course navigation in Canvas course.
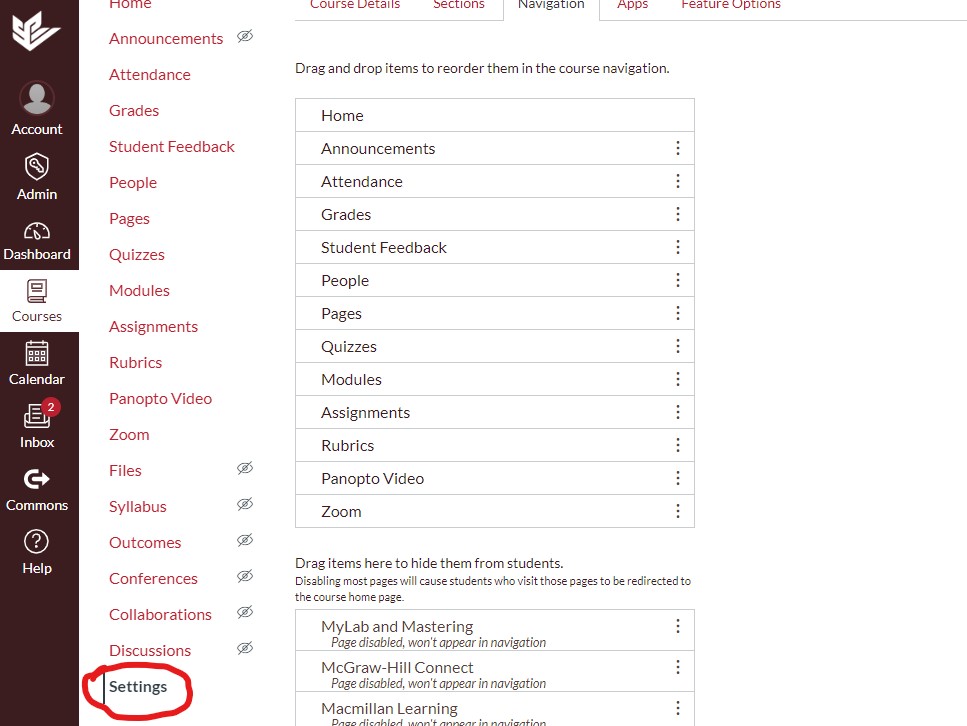
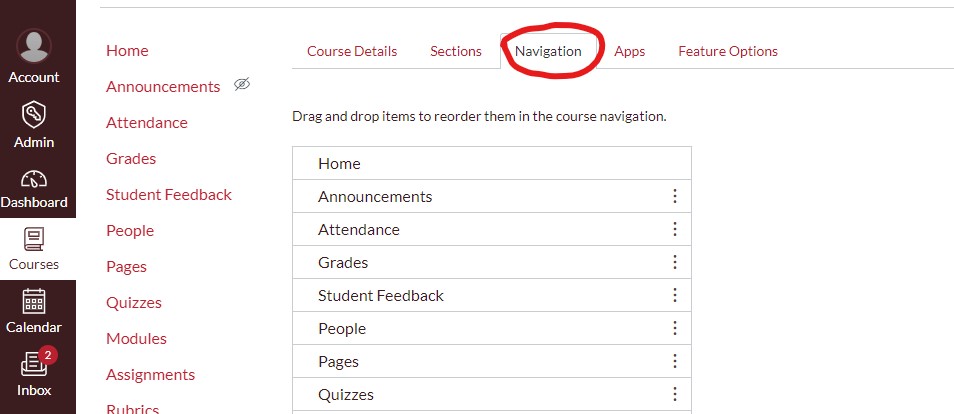
- Navigate to Navigation tab. Enable it.
Once activated, in the Global Navigation, click the name of the course.
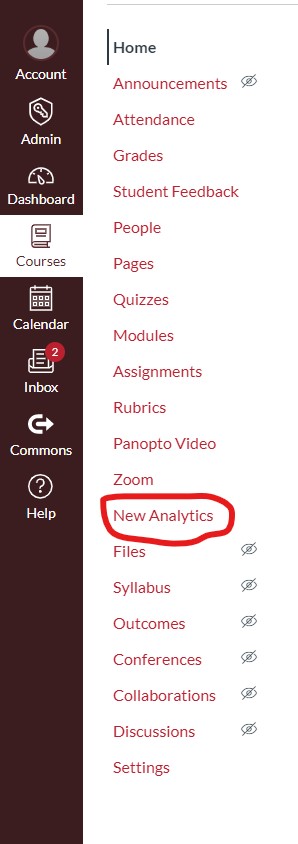
- To open the New Analytics, click the New Analytics link in course navigation.
- View Data Status

- Open Student Analytics table.

- In the student analytics table, click the name of the student.

- To locate a student, sort the table by student name or any other column.
- View Student information. When viewing analytics for an individual student, you can view the student's name and send a message to the student.

- By default, the student analytics opens to the Course Grade tab. The Course Grade chart graph shows the submission status and grade for all the assignments in the course. The student's current course grade is shown above the chart graph.
- You can view Course Grade Data table, weekly online activity graph, communication graph.
Note
Communication between students and teachers often happens outside of the LMS, it is not included as a participation metric. However a history of inbox messages sent between students and instructors is included so that it can be viewed alongside participation metrics.
- To view weekly online activity in a table, click the Options icon. Select Data table. The data table will show the week start date, number of page views and number of participants.


Additional Resources